Flattie
- UX
- Web development
- Data analysis
- 2017-2018
A data visualisation web app to help find a place to live
Renting is expensive.
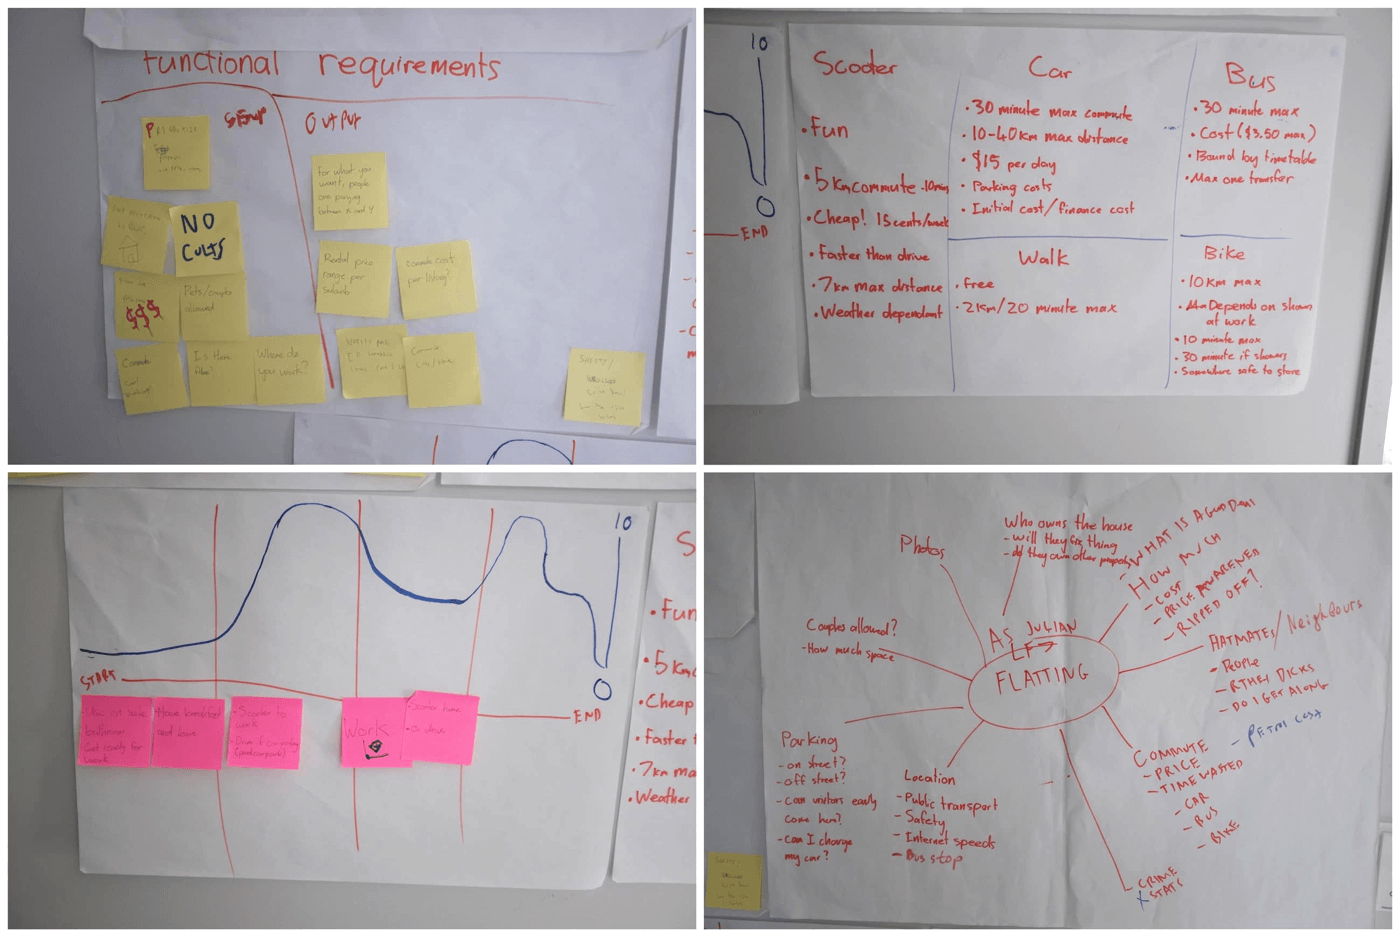
This frustrated myself and some friends. We wanted to take a closer look at housing affordability.
By interviewing friends and colleagues, we discovered a disconnect between the perceived state of the Auckland housing market, what is really available, and what people actually need in a house. We tried to help out with some pricing data visualisations. This is the result.

Stay engaged
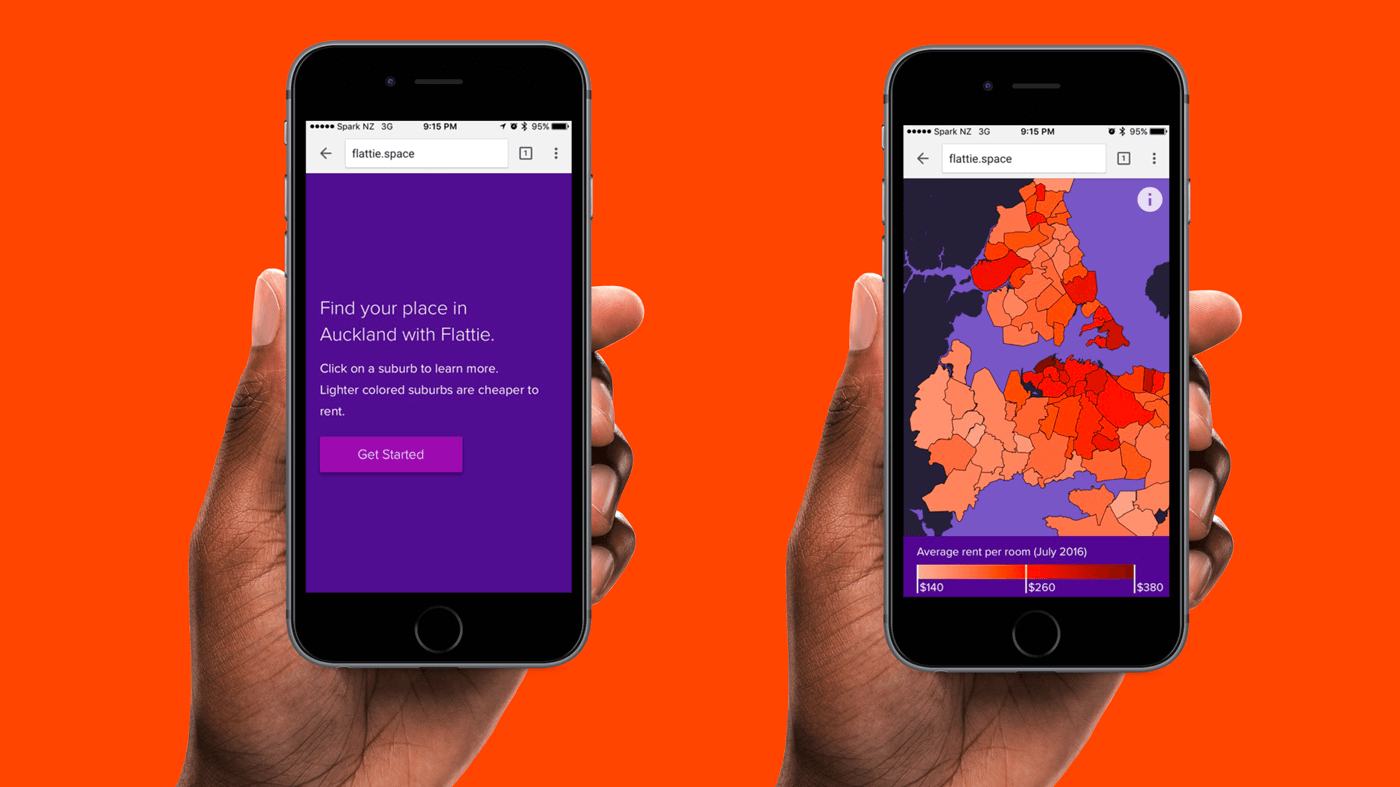
Let’s face it. Finding a place to live is extremely stressful and overwhelming, even for experienced renters and buyers. We saw an opportunity to add a layer of engagement and a way to encourage exploratory interactions through an affordability heatmap.
Behind the curtain
Based upon Google Maps and GeoJSON, Flattie matches suburb data sourced from MBIE with suburb definitions from Trade Me, and displays them through a third source of suburbs from Google maps (Our source of truth for when defining a suburb).
In the team I managed the manipulation of data sets, API requirements from Trade Me, promo video (above) and front end design.
Flattie was created as a part of an AUT bachelor of Creative Technologies, and is under ongoing future development.
View the live project here
Made with love by:
• Julian de Villiers
• Walter Lim
• Matvey Tarchutkin